
Breaking down the S&P 500
- Agris Gruzdas

- Jul 24, 2020
- 3 min read

Let's look at the S&P 500 index, one of the most widely viewed stock indices in the world which consists of the 500 largest US companies. There are so many speculations and assumptions recently regarding this index and its movements that I want to break it down to you – what’s the actual weight of each sector in this index and why you should be aware of it.
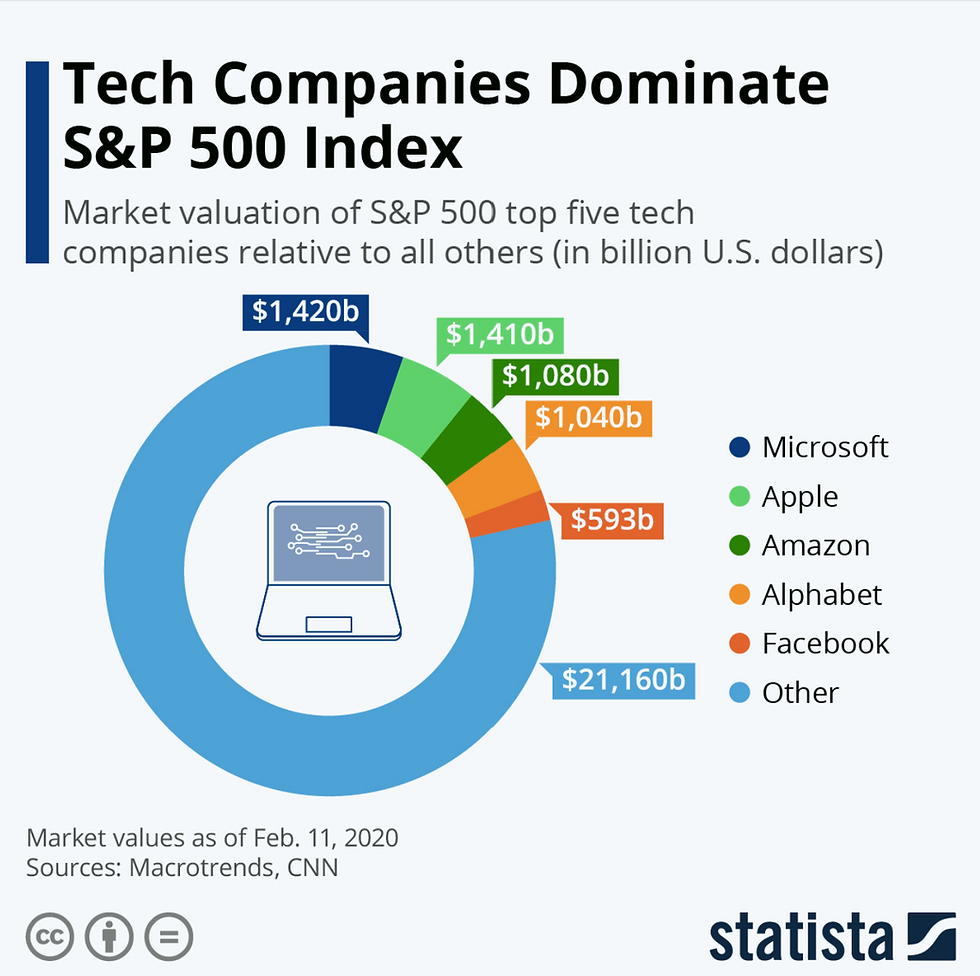
Let’s start with this info-graphic by Statista. Immediately you can see the big influence of the large tech companies. Only 5 out of 500 largest US companies account for just under 20% of the market value for the entire S&P. This was the Statista data as of 11 February 2020.
If we look how this proportion has changed within only 4 months (as of 7 July 2020), the top 5 tech companies now account for nearly 25% of S&P 500.

Now, if we look at the increase in YTD (from the beginning of the year to today), both for the index and the sectors separately, then we see that only 4 out of 11 sectors are in positive territory at the moment.

So, it is safe to say that technology companies are carrying the entire index on their shoulders.
If we take a closer look at the Consumer Discretionary sector, as the second positive sector of the index, then again we see technology companies, or the industry “Internet and direct marketing retail”. The Internet and Catalog Retail Industry in the Consumer Discretionary Sector includes mail order and door-to-door retailers, TV home shopping retailers, and companies providing retail services primarily on the Internet not classified elsewhere.

Looking at these charts, I would say that the most markets are in negative territory. And Covid-19 is definitely not a helper and a solution to all this.
Since top 5 tech giants are so valuable to S&P 500, let’s see how great is their ability to continue their growth. Please don’t get me wrong, I don’t say that is something wrong about these tech companies or you should not invest in them if you strongly believe you should. However, I see that they are strongly related to each other. Here, have a look at this chart where I have combined the Nasdaq index, the S&P 500 technology sector and the top 5 technology companies on one chart.

What does this graph give me?
A clear understanding that they are all, more or less, in "the same boat". And if someone "coughs up", the infection will spread quickly, just like COVID-19 does. And what's more, the cough will hit the entire S&P 500 index. And if you have all these companies in your portfolio, then it is clear that the risk is huge. I think that it would be wise to make corrections in part of such portfolio and mitigate the impact of eventual disaster.
Whenever I see such a huge impact on the common market, it makes me wonder – is this normal at all? haven’t we see something similar before? Isn’t that a bubble?
I'm looking for the answer to this question here: comparing Nasdaq and S&P 500:

All I can say that the "history repeats itself". We already have seen the similar case and it was called the "Tech Bubble", and it is clear that the growth of technology companies is parabolic.
And here's a place for reflection…
I'm not saying that the Tech victory march has to end. After all there’s something very truthful in saying "software is eating the world". I believe that we need to look at all this with great caution, without FOMO and think more about not losing money in the event of a bubble burst.
And yet, keep track of the profits and reports of these companies, because they are currently determining the market and mood as such. If the positivism in the technology sector disappears, then the current positive mood in the market will quickly disappear as well.
Stay tuned!
Agris


Comments